Data Acquisition with NIDAQ Boards
NOTE: before working with PYDAQ, device driver should be installed and working correctly as a DAQ (Data Acquisition) device
Data Acquisition using Graphical User Interface (GUI)
Using GUI to acquire data is really straightforward and requires only two LOC (lines of code):
After this command, the graphical user interface screen will show up, where the user should select the NIDAQ option and go to the Get Data tab, to define parameters and start acquiring data.
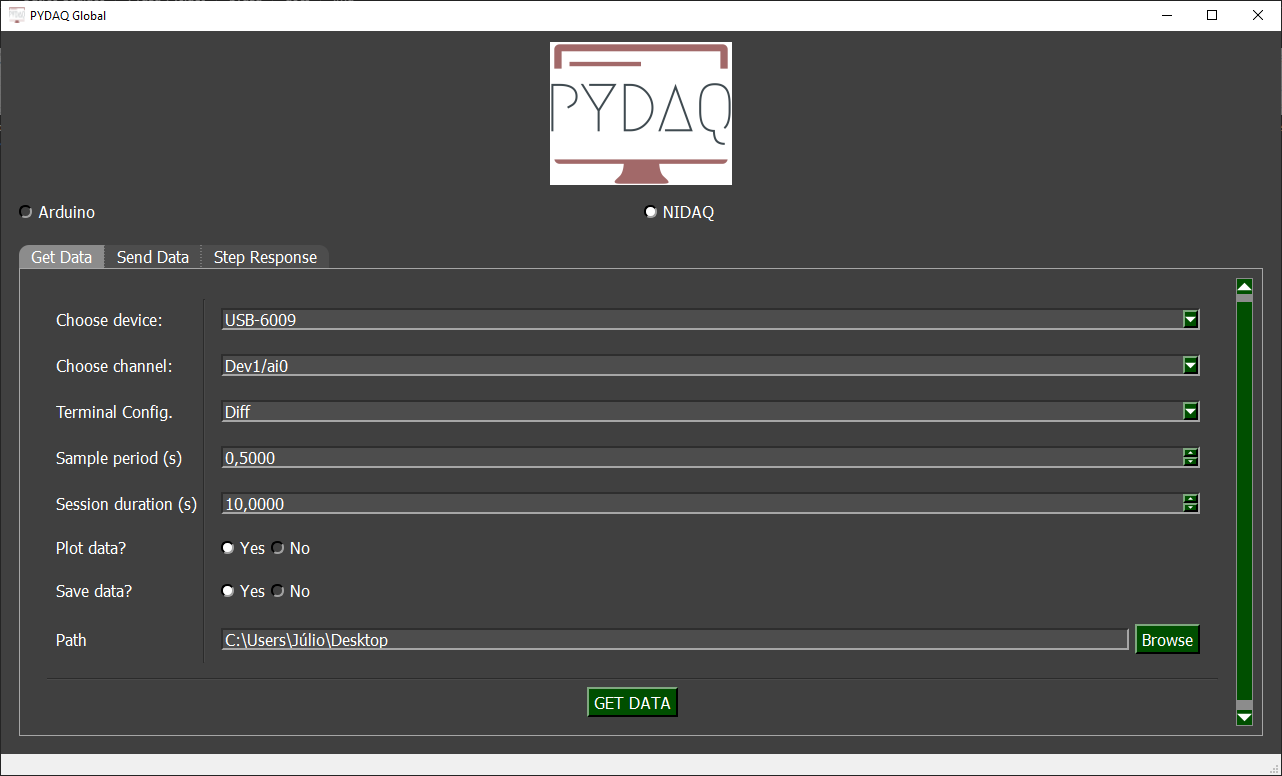
The user is now able to select the desired device, channel, terminal configuration (Differential, RSE and NRSE), sample period and session duration. Also, the user will define if the data will be plotted and saved or not, as well as the path to save data.
Data Acquisition using command line
It will be presented how to use GetData (and get_data_nidaq) to acquire signal using a National Instruments board.
Firstly, import the library and define the parameters:
# Importing PYDAQ
from pydaq.get_data import GetData

# Defining parameters
device_name = "Dev1"
channel_used = "ai0"
terminal_configuration = 'Diff'
sample_period_in_seconds = 1
session_duration_in_seconds = 10.0
save_data = True
will_plot = "no" # Can be realtime, end or no
Then, instantiate a class with the defined parameters and get the data
# Class GetData
g = GetData(device=device_name,
            channel=channel_used,
            terminal=terminal_configuration,
            ts=sample_period_in_seconds,
            session_duration=session_duration_in_seconds,
            save=save_data,
            plot_mode=will_plot)

# Method get_data_nidaq
g.get_data_nidaq()
NOTE: data will be saved on the desktop, by default. To change the path, the user can define "g.path = Desired path"
Presenting the acquired data
To show acquired data, type:
print(f'First 10 values of time: \n {g.time_var[0:10]}')
print(f'\nFirst 10 values of data: \n {g.data[0:10]}')
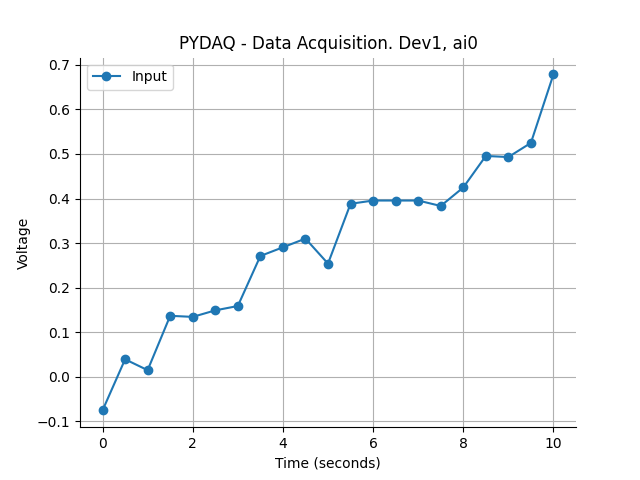
If you choose to plot, you can see acquired data on screen, i.e:
Data will also be saved as depicted as shown below:
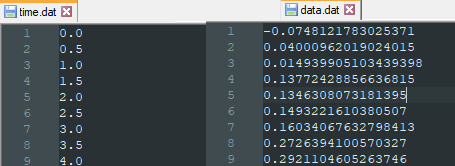
You can see more detailed bellow: