Sending Data with Arduino Boards
NOTE 1: before working with PYDAQ, device driver should be installed and working correctly as a DAQ (Data Acquisition) device
NOTE 2: To acquire/send data with arduino, the code provided here (located at arduino_code) should be uploaded in Arduino first. Default output port is 13 and this port can be changed in the above mentioned code. This code only works with digital output, since this is a limitation of Arduino Boards.
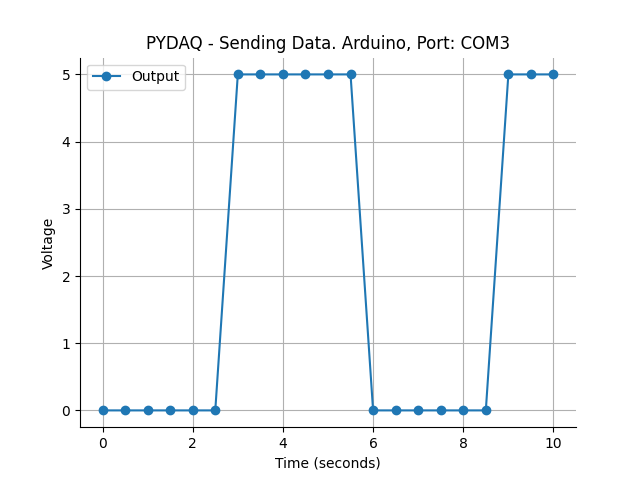
NOTE 3: Since are used digital output ports, the output will be 0V if data < 2.5 and 5V otherwise.
Sending Data using Graphical User Interface (GUI)
Using GUI to send data is really straighforward and require only two LOC (lines of code):
After this command, the graphical user interface screen will show up, where the user should select the Arduino option and go to the Send Data tab, to be able to define parameters and start to send the data.
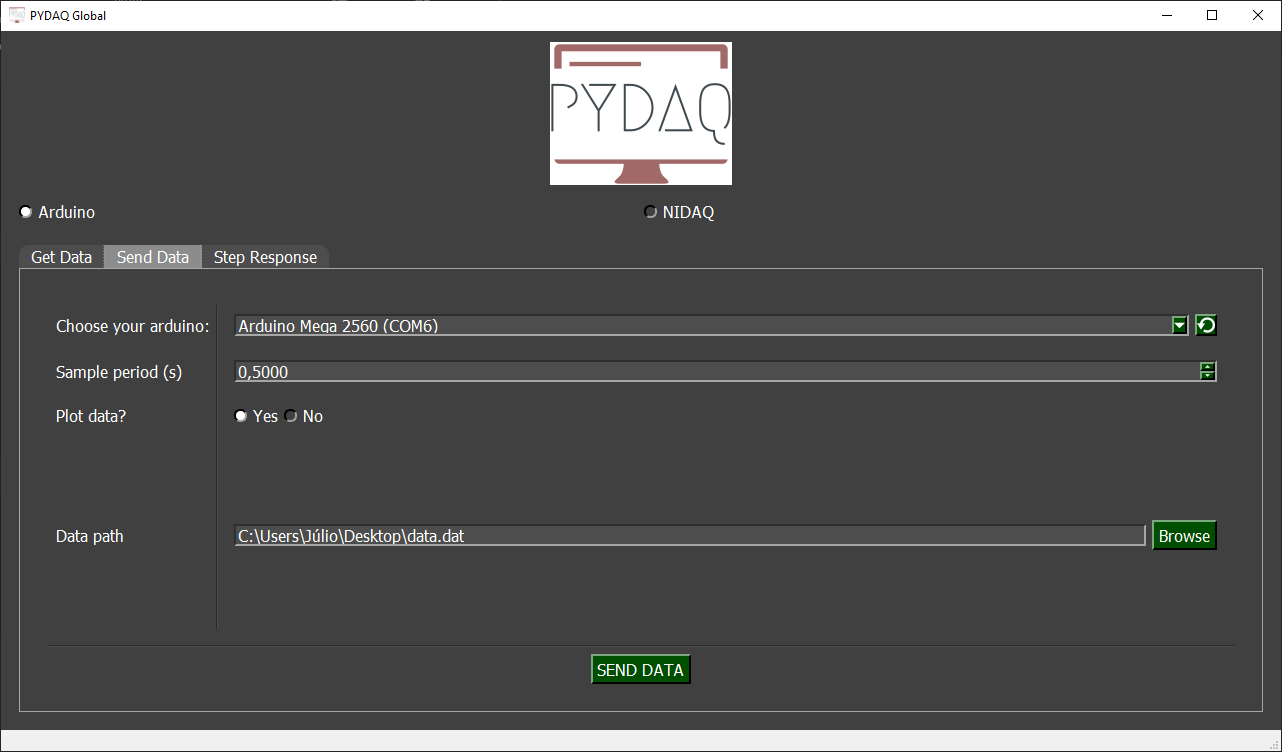
The user is now able to select desired Arduino and sample period. Also, the user will define if the data will or not be plotted. The data that will be sent should be in the range (0-5V).
Data should be formated as one data per line and saved as a .dat file. After configuration is done, the user only need to click on SEND DATA button to start the process.
Sending data using command line
It will be presented how to use SendData (and send_data_arduino) to send a signal using an Arduino board.
Firstly, import library and define parameters:
# Importing PYDAQ
from pydaq.send_data import SendData

# Defining parameters
sample_period_in_seconds = 1
data = [0, 0, 5, 5, 0, 0, 5, 5, 0, 0, 5, 5]  # It can be either a list or a numpy array
com_port_arduino = 'COM3'
will_plot = "no" # Can be realtime, end or no
Then, instantiate a class with defined parametes and send the data
# Class SendData
s = SendData(data=data,
             com=com_port_arduino,
             ts=sample_period_in_seconds,
             plot_mode=will_plot)

# Method send_data_arduino()
s.send_data_arduino()
If you choose to plot you can see the data sent on screen, i.e: